Jonh Astete-Cornejo
Fernando G. Benavides
ORIGINAL ARTICLE
Working, safety
and health conditions in the economically active and employed population in
urban areas of Peru
Iselle Sabastizagal-Vela
![]() 1,2,
Psychologist,
Master in Occupational Health
1,2,
Psychologist,
Master in Occupational Health
Jonh Astete-Cornejo
![]() 1,2, medical specialist in
Occupational and Environmental Medicine, Master in Business Administration with
specialization in Integrated Quality, Safety and Environmental Management
1,2, medical specialist in
Occupational and Environmental Medicine, Master in Business Administration with
specialization in Integrated Quality, Safety and Environmental Management
Fernando G. Benavides
![]() 3,4, medical
specialist in Preventive Medicine and Public Health, Doctor of Medicine.
3,4, medical
specialist in Preventive Medicine and Public Health, Doctor of Medicine.
1 Instituto Nacional de Salud, Lima,
Peru.
2 Universidad Peruana Cayetano Heredia,
Lima, Peru.
3 Centro de Investigación en Salud
Laboral (CiSAL), Barcelona, España.
4 Universitat Pompeu Fabra, Parc Salut
Mar, Barcelona, España.
ABSTRACT
Objetives: The present study aims to know the work, safety and health
conditions at the jobs of the economically active urban population in Peru.
Materials and Methods: A cross-sectional study was carried out based on a probabilistic
sample of multistage areas in which 3122 people over 14 years of age
distributed nationwide participated.
Results: The majority were men (53.6%) between 30 and 59 years (50%). As
for working conditions, most people work more than 48 hours per week (39.8%),
and Monday through Saturday (44.7%). Regarding the safety, hygiene, ergonomic
and psychosocial conditions, the results showed a lower risk exposure.
Regarding health conditions, the majority report that the identification and
evaluation of occupational hazards is not carried out in their workplace
(35.9%), they do not have occupational health services (40.7%) or a delegate or
a Health and safety committee (39.4%) and no occupational medical evaluations
(39.3%).
Conclusions: The economically active urban population of Peru is more
frequently exposed to noise, solar radiation, awkward postures and repetitive movements,
work at a fast pace with little control and hide their emotions; In addition,
occupational health is not managed adequately in workplaces. These conditions
may affect the health of workers and the quality of work.
Keywords: Working Conditions; Occupational Risks; Employment; Occupational Health (Source: MeSH NLM).
INTRODUCTION
Employment
generates economic and social growth and affects workers’ health and
well-being, i.e. it can be a source of improvement or harm. Paid work is the
main source of income for most people, and it is a strong component of their
social identity (1).
Workers are exposed to conditions that affect their
health, either positively or negatively. Such conditions involve the characteristics
of the work organization, its environment and immediate surroundings, which can
be considered physical, chemical, psychosocial, mechanical, and environmental
risk factors, among others. Therefore, occupational health and safety
conditions are established in organizations, these are related to the
implementation of measures to eliminate or reduce the risk of suffering
injuries, damaging health, material damage to equipment, machines or
infrastructure. Similarly, workers’ health management, and preventive
activities and resources involved within the organizations, are included (1,2).
Therefore, a worker with adequate working, safety
and health conditions is strongly identified with the organization’s policies
which are strengthened, as well as his or her motivation and productivity. On
the contrary, if the workplace has precarious conditions, the workers’ health
could be affected, in addition to the previously mentioned aspects, which
generates a high social cost (2).
According to the International Labor Organization,
there is a high frequency of deaths caused by work accidents or diseases,
related to poor occupational safety and health practices. These health issues
generate a high social and economic cost, due to losses related to working
time, production development, medical care and rehabilitation of workers, as
well as the payment of compensation (3,4).
On the labor aspect, Peru maintained an economic
growth that allowed a 2.4% increment of formal employment from April 2013 to
March 2014 (5),
and Metropolitan Lima showed a variation of 6.6% during first quarter 2019 (6). In addition, under the Occupational Safety and Health Act,
employers must create means and conditions to protect workers’ health and
safety (7)
by developing management systems according to their needs, and
report to the Ministry of Labor any occupational accidents and diseases that
occur in their organizations (8).
|
KEY MESSAGES |
|
Motivation for the study:
To know the working, safety and health conditions of the urban
economically active occupied population of Peru.
Main findings:
The
urban economically active occupied working population is more frequently
exposed to noise, solar radiation, uncomfortable postures and repetitive
movements; they work fast with little control and hide their emotions;
moreover, occupational health is not managed in the workplace. These
conditions can affect workers’ health and the quality of their work
Implications: Knowing working and health conditions of the economically
active population will allow the establishment of guidelines for improvement
within the framework of the Law on Safety and Health at Work |
Occupational surveys on working conditions are
valuable tools for obtaining information to develop strategies for promoting
health and preventing negative events for working groups. These surveys are
useful for monitoring workers’ health (9), and working, employment and
health conditions worldwide.
As indicated in the National Plan for Occupational
Safety and Health 2017-2021 (8), there are national statistics on occupational
accidents and diseases; however, they do not express all of the occurrences,
nor do they record the working conditions of the economically active population
(EAP). For this reason, the aim of the present study was to determine the
safety and health conditions at work of urban economically active occupied in Peru,
by applying a population survey.
MATERIALS AND
METHODS
Study Design
A
cross-sectional design study based on a probability sample associated to
geographical areas, in which the likelihood of being selected is associated
with geographical areas in the scope of study, which is also multi-stage. The
sample was designed to give reliable estimates at the national urban level.
Sample Framework
The
sample framework was obtained from the statistical information of the National
Institute of Statistics and Informatics (INEI in Spanish), from the 2007 Census
and updated with information from the Household Targeting System (SISFOH in
Spanish) 2012-2013, a system used by the INEI for conducting population surveys
(10).
The population comprises the habitual residents, over 14 years old, from urban
private dwellings nationwide. The sample used was requested from the INEI,
which included clusters with information on blocks, dwellings, population and EAP
from 252 districts of Peru.
Participants
Residents of urban areas of Peru, over 14 years old, who work or
have worked, at least for one hour, the week before the survey or who are
temporarily absent from work due to vacation, illness, leave, etc. (11).
Children under 14 years old and those children whose surveys showed errors in
completion were excluded.
Sample
The sample was probabilistic, area-based,
stratified and multi-stage. With a known population and applying the proportion
formula with a confidence level of 95%, a permissible error of 2.7%, a
non-response rate of 10% and a design effect of 1.2. The calculated sample was
3,120 persons distributed in 520 clusters.
The sampling was carried out in several stages.
First stage: selection of clusters with probability proportional to the size of
the households (clusters: group of households defined by the INEI that include
approximately 100 to 150 households). Second stage: selection of blocks within
each cluster (systematic random sampling with random start). Third stage:
random selection of households in the selected blocks (random sampling through
a random number chart). Fourth stage: random selection of the person to be
interviewed. The unit of analysis was the working person, selected among people
who work in each household.
Variables
Socio-demographic variables, such as sex, age, education, job,
economic activity of the company and number of workers. Working conditions,
including employment conditions (weekly working hours, working days, type of
relationship, contract, form of contract, type of workday, remuneration), other
conditions such as safety, hygiene, ergonomic and psychosocial factors,
resources and preventive activities (information or training on occupational
risks, evaluations, measurements or controls of possible risks, access to
occupational health services, occupational health and safety or hygiene
committee, occupational medical examination, and workers participation). Health
conditions, such as the perception of health, as well as injuries, and
occupational diseases.
Instrument
The Basic Questionnaire on Working, Employment and
Health Conditions in Latin America and the Caribbean (CTESLAC in Spanish) (12,13) provides
information on workers’ perceptions of working, employment and health
conditions in their workplaces. It has 77 questions which include
socio-demographic characteristics, employment conditions, work, health,
resources, and preventive occupational health activities in the work centers,
and family characteristics of the respondents. It was developed by the Network
of Experts on Surveys of Working, Employment and Health Conditions (RED ECTS in
Spanish), based on surveys of working conditions used in Spain, Colombia,
Argentina, Chile, Uruguay and Central America, in order to improve the
comparability of survey results in Latin America and the Caribbean.
The
answers to the questions include: frequency of the condition (always, several
times, sometimes, very few times and never; or if it presents or not a certain
condition), the completion time of the questionnaire is of 25 minutes and the
results are expressed according to the answer options.
For this study, a group of 34 experts in
occupational health (doctors, psychologists, nurses and medical technologists)
reviewed and adapted the questionnaire. They discussed the relevance of each
item, and the application of a pilot questionnaire to 34 workers in Lima, Ica
and Arequipa. The partial response rate (i.e., the omission of information in
some of the questions) (14) was 3.2%.
An
acceptable correlation was found in safety (0.52-0.77), hygiene (0.29-0.50) and
ergonomics (above 0.3). However, the psychosocial aspect showed a low
correlation (less than 0.3). Overall, the questionnaire has a high reliability
of the safety, hygiene and ergonomic aspects (15). It is important to point
out that, regarding the correlation of psychosocial conditions, we consider
that it does not affect the gathering of information, since the questionnaire
is not a diagnostic instrument and therefore allows for the collection of
relevant information on working conditions.
The final version of the questionnaire consists of
three filter questions and 87 Likert-scale questions. An adequately trained
interviewer applied the questionnaire to the participants in their homes, with
an average duration of 20 minutes.
Procedure and
statistical analysis
The information-gathering phase took place from
November 2016 to June 2017. The process was gradual and on different dates,
however, it was simultaneous at some points. For this purpose, experienced
surveyors were called in, and the team of researchers trained them in
occupational health, working conditions, handling the questionnaire and
selecting the respondents in the field. The questionnaire was printed on paper
and applied to each participant.
For
the selection of the household, in each cluster (according to the criteria of
the INEI, as a
subpopulation, which has characteristics present in
the population, with attributes such as geographical location, being over 14
years old, worker (16)), the following procedure was taken into account: at
random, in each block, the households were selected (nine households, of which
three were replacement households, in the event that a possible participant was
not identified), and then, for the random selection of the occupied EAP member,
within the households, the Kish (or random) chart was used.
To calculate the confidence intervals (sampling
errors), the statistical program SPSS 20, complex samples section, was used,
which provides the sample variability estimators for population parameters (the
elaborated frequency plan contained: the file plan, the frame stratum, the
cluster and the expansion factor by district, for the construction of the
expansion factors, the selection probabilities in each stage were taken into
consideration), such as totals, means, ratios and proportions for the different
estimation domains, and the algorithm used by SPSS is based on the method of
the variance estimators of the final clusters (17).
Ethical aspects
The study was approved by the Institutional Committee of Ethics
and Research of the National Institute of Health. Informed consent (assent for
those under 18 years old) was applied, which was codified and guarded by the
research team.
RESULTS
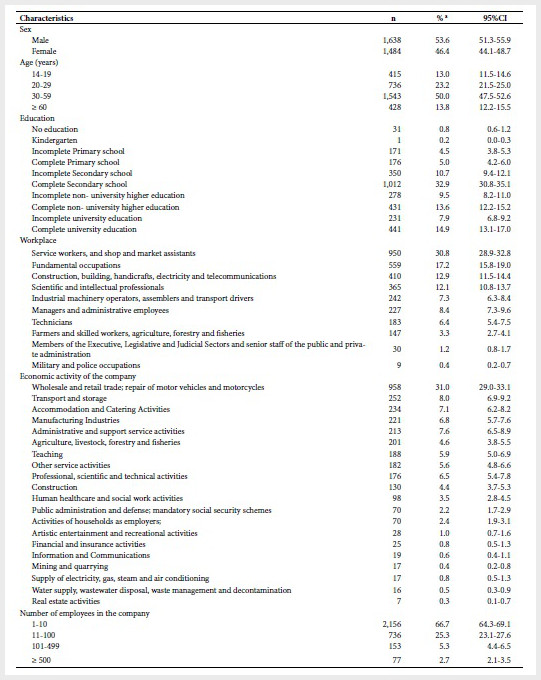
Table 1. Socio-demographic characteristics, jobs,
economic activity and number of workers in the company, Peru, 2017
95%CI: 95% Confidence Intervals
a Weighted percentages according to expansion factors
In terms of employment, most were service workers
and shop and market assistants (30.8%), from wholesale and retail trade sector,
in the repair of motor vehicles and motorcycles (31.0%), and worked in small
centers, that is, between 1 and 10 persons (66.7%).
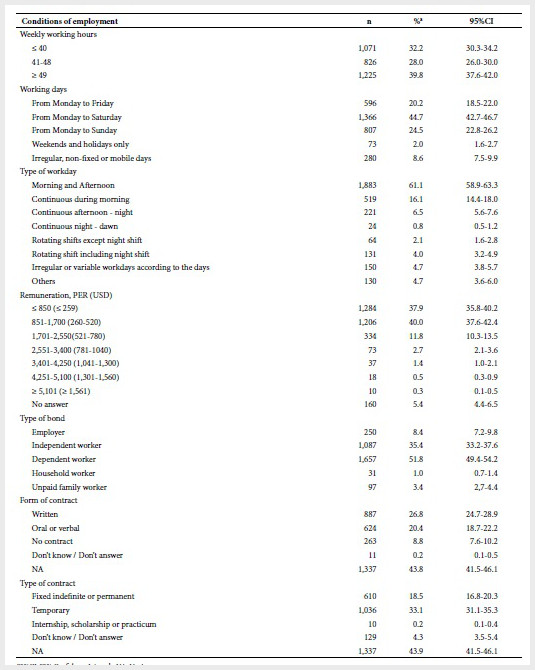
Regarding working conditions (Table 2), 39.8%
worked 49 hours or more per week; 44.7% worked from Monday to Saturday; and
61.1% worked split shifts, morning and afternoon. Regarding the net monthly
income of the participants, the highest percentage received remuneration
between 851 soles and 1,700 soles (40%); 51.8% were dependent workers; and
regarding the form and type of contract, 26.8% had a written contract and 33.1%
a temporary contract. With respect to the social protection coverage of the
interviewees, 67.2% said that they did not contribute to any retirement system
and 53.5% did not have any health insurance (Figure 1).
Table 2. Employment conditions by weekly working
hours, working days, type of workday, remuneration, role, contract and type of
contract in workers in Peru, 2017
95%CI: 95% Confidence Intervals, NA: No Answer
1 USD= 3,27 PER (change rate for 2017)
a Weighted percentages according to expansion factors
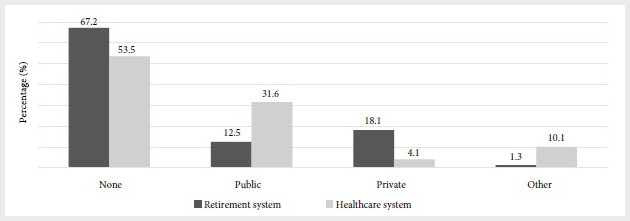
Figure 1. Employment conditions by social protection
coverage according to the pension system, 2017
With respect to exposure to occupational risk
factors, less than 6.5% of those surveyed indicated that they are often or
always exposed to falls at the same or lower levels; more than 7% of workers
reported that they are often or always exposed to a level of noise that forces
them to raise their voice to talk to another person and more than 8% reported
that they are oftenor always exposed to solar radiation for a minimum period of
one hour per day. Their tasks make them keep uncomfortable or forced postures
(12.9%) or to make repetitive movements (21.6%). Psychosocially, they must work
very fast (13.9%) and hide their emotions or feelings when doing their work
(12.9%) (Table 3).
Table 3. Working conditions according to safety,
hygiene, ergonomics and psychosocial aspects of workers in Peru, 2017
SC: safety conditions; HC: hygiene conditions; EC: ergonomic
conditions; PC: psychosocial conditions; DK/DA: don’t know / don’t answer
a Weighted percentage according to expansion factors.
b Do you work in environments with unstable, uneven and/or slippery
floors, which may cause you to fall?
c Do you work in environments with surfaces with holes, stairs
and/or unevenness that can cause you to fall?
d Do you use equipment, instruments, tools and/or work machines
that can cause you damage or injury such as cuts, blows, scratches or scrapes,
punctures, amputations, etc.?
e Are you exposed to a level of noise that forces you to raise your
tone of voice when talking to others?
f Do you inhale chemicals in the form of dust, fumes, aerosols,
vapors, gases and/or mist? It does not include tobacco smoke.
g Do you handle, or are you in contact with, animals or people who
may be infected, or contaminated materials such as garbage, body fluids,
laboratory equipment, etc.?
h Are you exposed directly to the sunlight or radiation for at
least 1 hour a day?
i Do you perform tasks that force you to maintain uncomfortable or
forced postures (positions)?
j Do you lifts, move, push or pull loads, people, animals or other
heavy objects?
k Do you perform tasks that require you to make repetitive
movements?
l Do you have to work very fast?
m Does your job demands that you have to control many things at
once?
n Does your job require you to hide your emotions or feelings?
o Does your job allow you to apply your knowledge and/or skills?
p Does your
job allow you to learn new things?
q Do you have any influence on the amount of work you are given?
r Think about all the work and effort you put in. Do you think the
recognition you receive at work is appropriate?
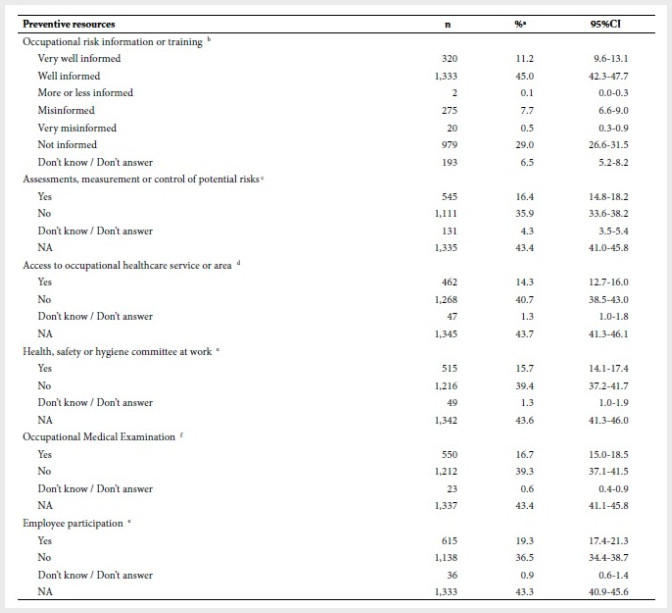
With regard to resources and preventive activities,
7.7% of the workers reported having received poor information about
occupational risks. With regard to the identification and evaluation of
occupational risks, 35.9% of the dependent workers did not have a risk
evaluation for their job in the last 12 months; 40.7% did not have an
occupational health service or area in their work center; 39.4% did not have a
prevention delegate or supervisor or an occupational health and safety or
hygiene committee; 39.3% did not have an occupational health examination in the
last 24 months, and 36.5% indicated that their work center did not hold regular
meetings to discuss health and safety issues (Table 4).
Table 4. Resources and preventive activities and
identification and evaluation of occupational risks for workers in Peru, 2017
95%CI: 95% confidence intervals, NA: No answer
a Weighted percentages according to expansion factors.
b Are you informed about the risks to your health and safety
related to your work?
c Do you know if any assessments, measurements or monitoring of
potential health risks have been carried out in your workplace during the last
12 months?
d Do you have access to an occupational healthcare service or area
at your workplace?
e Is there a delegate, supervisor, health, safety or hygiene
committee in your workplace?
f Have you had an entry, periodic or retirement medical
occupational examination in your workplace during the last 24 months?
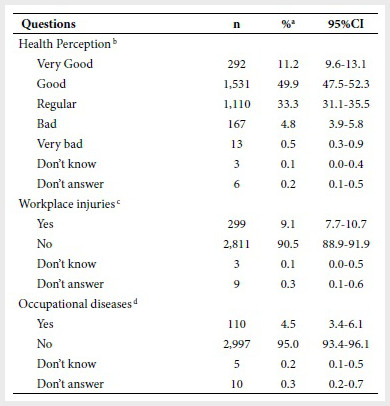
Finally, regarding the participants’ perception of
their health in general, the majority (49.9%) responded that their health was
good. A total of 9.1% reported that they had suffered some injury or damage due
to an accident at work, and 4.5% reported that they had suffered from one or
more diseases caused by work (Table 5).
Table 5. Perception of health, injuries and
occupational diseases in workers in Peru, 2017
95%CI: confidence intervals
a Weighted percentages according to expansion factors.
b In the last two weeks, in general, which of the following
statements reflect your health state?
c During the last 12 months, have you suffered any injury or damage
due to an accident at work?
d During the past 12 months, have you suffered from one or more
illnesses diagnosed by a doctor, caused by work?
DISCUSSION
Peru’s urban occupied active population has a profile
characterized by a high percentage of workers with long working hours, low
social protection coverage (the highest percentages of workers were not
registered in any retirement plan or health system), and independent workers
have long working hours, low pension coverage and low economic income. These
situations can affect workers’ health and performance, as well as the quality
of their work, which could be related to informality or precariousness of
employment. These results are different from those reported in Colombia (18),
Argentina (19),
Chile (20)
and Central America (21), where most workers do have
these systems.
A total of 9.2% of participants always work in noisy
environments, a frequency of exposure lower
than the observed in other countries of the region (19-21),
which in general exceed 15%. This differs to the report made in 2017, when
59.2% of the occupational illnesses notified to the Ministry of Labor and
Employment Promotion (MTPE in Spanish) of Peru (22) were due to hearing loss or deafness caused by
noise. However, this higher percentage of hearing-related illnesses may be
explained by a lower quantity of reported cases from other pathologies.
Between 9.1% and 21.6% of surveyed subjects suffer
from uncomfortable postures, they lift or move loads, or make repetitive
movements. These figures are lower than those observed in the surveys carried
out in Colombia, Argentina, Chile, Central America and Uruguay (23).
However, no musculoskeletal diseases related to such exposure were reported in
the MTPE (22) during 2017. Regarding psychosocial conditions,
between 12% and 41% of the population surveyed said that they always work too
fast or hide their emotions, or that they never influence the amount of work
assigned to them, similar to that found in surveys in other countries (19-21).
It should
also be noted that this is the first time that Peru gets information on
prevention and resources from companies, which, according to the regulations (7),
they are the ones that must carry out these preventive activities. The surveyed
subjects report that their work organizations do not identify nor evaluate
occupational risks at workplace, provide occupational health service, consider
a prevention delegate or supervisor at the workplace, provide annual
occupational medical evaluations. These reported information by the subjects
can be explained by the fact that not all employers have implemented the
guidelines of the Occupational Safety and
Health law in their organizations, or, that workers are not correctly
informed about it.
As for the perception of health, this is similar to
that found in the surveys of Colombia, Chile and Central America, which
perceive, in a high percentage, that their workers are healthy, and have a low
percentage of accidents and occupational diseases. Similar to what was found in
the National Socio-economic Survey about Access to Health from EsSalud Insured
Persons in Peru (24), which indicates that 64.1% of the insured population
refers having no symptoms, illness or accident.
Among the advantages of this study, it should be
mentioned that, in order to obtain the information, the surveys were applied in
the households, having as a common filter people who had worked, at least one
hour, in the week prior to the interview. Unlike the surveys carried out in
Colombia (18),
Argentina (19),
Chile (20) and Uruguay (23), where the interviews took
place in the formal workplaces.
Among the limitations, it should be mentioned that
the information collected has not been verified. That is, the instrument
collects the perceptions of the workers and this information is based on their
honesty (we do not verify the conditions in their workplaces), which is common
in this kind of study. Similar surveys were conducted in the European Union
since 1990, every five years (25). However, and despite the fact that
information was not verified, this study provides for the first time a
description of the working, employment and health conditions in a
representative sample of the occupied active population in urban areas of Peru.
In conclusion, there is ample room for occupational
risk prevention among Peru’s urban occupied
economically active population, especially among dependent workers with
long working hours, low social protection coverage and low economic income,
poor occupational health management in their workplaces; situations that might
affect their health and performance, as well as the quality of their work.
This first task provides the basis for monitoring
and surveillance of the working, employment and health conditions of the urban
occupied active population in Peru. Similar studies should be carried out
periodically. In addition, occupational health information should be
disseminated to raise awareness in the workers (independent and dependent) and
their employers in order to reduce exposure to occupational risks and prevent
work-related accidents and diseases.
Acknowledgements:
To the district authorities and to the EAP participating in the study. To Miguel Burgos, for his support in editing the manuscript and to the postgraduate collaborators in Occupational Health, Occupational Medicine and Environment of the Universidad Peruana Cayetano Heredia and the Universidad Nacional Mayor de San Marcos, for their support in the process of adaptation and application of the questionnaire
REFERENCES
1. Neffa
JC. Los riesgos psicosociales en el trabajo: contribución a su estudio
[Internet]. Buenos Aires: Centro de Estudios e Investigaciones Laborales
CEIL-CONICET; 2015. 550 p. [citado el 19 junio 2019]. Disponible en: http://biblioteca.clacso.edu.ar/Argentina/fo-umet/20160212070619/Neffa.pdf.
2. Neffa
JC. ¿Qué son las condiciones y medio ambiente de trabajo? Propuesta de una
perspectiva [Internet]. Buenos Aires: Hvmanitas-Ceil;
2002. [citado el 5 junio 2019] Disponible en: http://www.referato.com/uba-proceso-2/neffa_Condiciones_y_medio_ambiente_de_trabajo.pdf.
3. Levaggi
V. ¿Qué es el trabajo decente? [Internet]. Ginebra: Organización Internacional
del Trabajo; 2004 [citado el 11 Sep 2015]. Disponible
en: https://www.ilo.org/americas/sala-de-prensa/WCMS_LIM_653_SP/lang--es/index.htm.
4. International Labour Organization. Safety and health at work: A vision for sustainable
prevention. XX World
Congress on Safety and Health at Work 2014 [Internet].
Geneva: ILO, 2014 [citado el 14 octubre 2019]. Disponible en: https://www.ilo.org/wcmsp5/groups/public/---ed_protect/---protrav/---safework/documents/publication/wcms_301214.pdf.
5. Instituto Nacional de
Estadística e Informática. Informe técnico de la situación del mercado laboral
en Lima Metropolitana [Internet]. Lima: INEI; 2019 [citado el 1 julio 2019].
Disponible en: https://www.inei.gob.pe/media/MenuRecursivo/boletines/04-informe-tecnico-n04_mercado-laboral-ene-feb-mar2019.pdf.
6. Ministerio de Trabajo y
Promoción del Empleo. Avance de los Resultados de la Encuesta Nacional de
Variación Mensual del Empleo (ENVME), marzo 2014 [Internet]. Lima: MTPE; 2014.
[citado el 20 mayo 2019] Disponible en: https://www.trabajo.gob.pe/archivos/file/publicaciones_dnpefp/2015/AVANCE_ENVME_Marzo_2014.pdf.
7. Reglamento de la Ley No 29783, Ley de Seguridad y Salud en el Trabajo.
Decreto Supremo N° 005-2012-TR [Internet]. Lima: Congreso de la Republica; 2012
[citado el 20 mayo 2019]. Disponible en: http://www.munlima.gob.pe/images/descargas/Seguridad-Salud-en-el-Trabajo/DecretoSupremo005_2012_TR
_ ReglamentodelaLey29783_LeydeSeguridadySaludenelTrabajo.pdf.
8. Ministerio de Trabajo y
Promoción del Empleo. Política y Plan Nacional de Seguridad y Salud en el
Trabajo 2017 - 2021 [Internet]. Lima: MTPE; 2018. [citado
el 20/08/2019] Disponible en: https://www.trabajo.gob.pe/archivos/file/CNSST/politica_nacional_SST_2017_2021.pdf.
9. Merino-Salazar P, Cornelio
C, Lopez-Ruiz M, Benavides FG. Propuesta de
indicadores para la vigilancia de la salud ocupacional en América Latina y el
Caribe. Rev Panam Salud
Pública. 2018;42:1–9 [citado el 6 mayo 2019]. Disponible
en: https://doi.org/10.26633/RPSP.2018.125.
10. Instituto Nacional de
Estadística e Informática. Encuesta Nacional de Programas Presupuestales
2011-2016 [Internet]. Lima: INEI; 2017 [citado el 31 enero 2020]. Disponible
en: https://www.inei.gob.pe/media/MenuRecursivo/publicaciones_digitales/Est/Lib1442/libro.pdf.
11. Instituto Nacional de
Estadística e Informática. Características de la Población Económicamente
Activa Ocupada [Internet]. Lima: INEI; 2012 [citado el 20/08/2019]. Disponible
en: https://www.inei.gob.pe/media/MenuRecursivo/publicaciones_digitales/Est/Lib1105/cap02.pdf.
12. Benavides FG,
Merino-Salazar P, Cornelio C, Assunção AA,
Agudelo-Suárez AA, Amable M, et al. Cuestionario básico y criterios
metodológicos para las Encuestas sobre Condiciones de Trabajo, Empleo y Salud
en América Latina y el Caribe. Cad Saude Publica. 2016;32(9):e00210715 [citado el 14 mayo 2019]. Disponible en: http://dx.doi.org/10.1590/0102-311X00210715.
13. Benavides F, Zimmermann M, Campos J, Carmenate
L, Baez I, Nogareda C, et
al. Conjunto mínimo básico de ítems para el diseño de cuestionarios sobre
condiciones de trabajo y salud. Arch Prev Riesgos Labor. 2010;13(1):13-22.
14. Instituto Nacional de
Estadística e Informática. Clasificacion Industrial
Internacional Uniforme de todas las actividaes economicas CIIU Revisión 4 [Internet]. Lima: INEI; 2010. [citado el 10 mayo 2019]. Disponible en: https://www.inei.gob.pe/media/MenuRecursivo/publicaciones_digitales/Est/Lib0883/Libro.pdf.
15. Sabastizagal
I, Vives A, Astete J, Burgos M, Gimeno Ruiz de Porras
D, et al. Fiabilidad y cumplimiento de las preguntas sobre condiciones de
trabajo incluidas en el cuestionario CTESLAC: resultados del Estudio sobre
Condiciones de trabajo, Seguridad y Salud en Perú. Arch
Prev Riesgos Labor. 2018;21(4):196-202
[citado el 14 agosto 2019]. Disponible en: http://dx.doi.org/10.12961/aprl.2018.21.04.3.
16. Instituto Nacional de
Estadística e Informática. Glosario de términos [Internet]. En: Compendio estadistico Perú 2016. Lima: INEI; 2016 [citado el
20/08/2019]. Disponible en: https://www.inei.gob.pe/media/MenuRecursivo/publicaciones_digitales/Est/Lib1375/glosario2.pdf
17. Instituto Nacional de
Estadística e Informática. Aspectos metodológicos [Internet]. Lima: INEI; 2012.
[citado el 05/11/2019]. Disponible en: https://www.inei.gob.pe/media/MenuRecursivo/publicaciones_digitales/Est/Lib1106/cap01.pdf.
18. Ministerio de la
Protección Social. Primera Encuesta Nacional de Condiciones de Salud y Trabajo
en el Sistema General de Riesgos Profesionales [Internet]. Bogotá: Ministerio
de Protección Social; 2007. Disponible en: https://www.minsalud.gov.co/Documentos%20y%20Publicaciones/ENCUESTA%20SALUD%20RP.pdf.
19. Ministerio de Trabajo,
Empleo y Seguridad Social. Primera Encuesta Nacional a Trabajadores sobre
Empleo, Trabajo, Condiciones y Medio Ambiente Laboral [Internet]. Buenos Aires:
MTEySS; 2009 [citado el 10 mayo 2019]. Disponible en:
https://www.argentina.gob.ar/sites/default/files/primera_encuesta_nacional_trabajadores.pdf.
20. Ministerio de Salud,
Instituto de Seguridad Laboral y la Dirección del Trabajo. Primera Encuesta
Nacional de Condiciones de Empleo, Trabajo, Salud y Calidad de Vida de los
Trabajadores (ENETS 2009-2011) [Internet]. Santiago: MINSAL; 2009 [citado el 8
mayo 2019]. Disponible en: https://www.dt.gob.cl/portal/1629/articles-99630_recurso_1.pdf.
21. Benavides FG, Wesseling I, Delclós G, Felknor S, Pinilla J, Rodrigo F, et al. I Encuesta
Centroamericana sobre Condiciones de Trabajo y Salud (I ECCTS). [Internet].
Organización Iberoamericana de Seguridad Social (OISS); 2012 [citado el 19 mayo
2019]. Disponible en: http://www.oiss.org/estrategia/encuestas/lib/iecct/ESTUDIO_CUANTITATIVO_ECCTSSALTRA9.pdf.
22. Ministerio de Trabajo y
Promoción del Empleo. Anuario estadístico sectorial 2017. [Internet]. Lima:
MTPE; 2018. [citado el 20/09/2019] Disponible en: https://cdn.www.gob.pe/uploads/document/file/229919/Anuario_2017_opt.pdf.
23. Merino-Salazar P, Artazcoz L, Cornelio C, Iñiguez MJI, Rojas M,
Martínez-Iñigo D, et al. Work and health
in Latin America: results from the
working conditions surveys of Colombia, Argentina, Chile, Central America and Uruguay. Occup Environ Med. 2017;74(6):432-9. [citado el 2
setiembre 2019]. Disponible en: http://dx.doi.org/10.1136/oemed-2016-103899.
24. EsSalud.
Presentación de los principales Resultados de la encuesta nacional
socioeconómica y de acceso a la salud de los asegurados de EsSalud
2015 [Internet]. Lima: EsSalud; 2016. [citado el 14 octubre 2019]. Disponible en: http://www.essalud.gob.pe/downloads/encuesta_nacional_socioeconomica/.
25. Eurofound.
Sixth European Working Conditions Survey–Overview report (2017 update) [Internet]. Luxembourg: Publications Office
of the European Union; 2017 [citado el 14 octubre 2019]. Disponible en: https://www.eurofound.europa.eu/sites/default/files/ef_publication/field_ef_document/ef1634en.pdf.
Funding:
Resources from the National Institute of Health of
Peru.
Citation: Sabastizagal-Vela I,
Astete-Cornejo J, Benavides FG. Working, safety and health conditions in the
economically active and employed population in urban areas of Peru. Rev Peru
Med Exp Salud Publica. 2020;37(1):32-41.
Doi:
https://doi.org/10.17843/rpmesp.2020.371.4592
Correspondence to:
Iselle Lynn Sabastizagal Vela; Centro Nacional de Salud
Ocupacional y Protección del Medio Ambiente para la Salud, Instituto Nacional
de Salud;
isabastizagal@ins.gob.pe.
Authors’ contributions: SIL and JMAC participated in the conception and design of the
article, data collection, data analysis and interpretation, writing of the
article, and approval of the final version. FGB, in technical advice, data
analysis and interpretation, critical review of the article and approval of the
final version.
Conflicts of interest:
This study does not represent any conflict of interest with the
authors or the institution.
Received:
06/06/2019
Approved:
19/02/2020
Online:
23/03/2020