Silvia Suárez-Cunza
Luis Salcedo-Valdez
María Soberón-Lozano
Kelly Carbonel-Villanueva
Rosa Carrera-Palao
1 Universidad
Nacional Mayor de San Marcos, Facultad de Medicina, Centro de Investigación
de Bioquímica y Nutrición, Lima, Perú.
2 Universidad Nacional Mayor de San Marcos, Facultad de Medicina,
Instituto de Patología, Lima, Perú.
This study is part of the master’s thesis: Maguiña-Alfaro M. Effect of L-carnitine on oxidative stress in an experimental model induced with a high fructose diet. Lima: Faculty of Pharmacy and Biochemistry, Universidad Nacional Mayor de San Marcos; 2020.
INTRODUCTION
In Peru, over the last few years, the number of patients with chronic non-communicable diseases related to inadequate nutrition, such as cardiovascular and respiratory diseases, cancer, and type 2 diabetes mellitus, has increased. Research on experimental animals has shown that a diet rich in fructose causes chronic inflammation, which can lead to obesity, insulin resistance and metabolic syndrome. The evolution of this process can generate diabetes mellitus type 2 (1,2).
Chronic non-communicable diseases are associated with oxidative stress, as well as fructose consumption. Oxidative stress is the imbalance between the production of reactive oxygen species (ROS) and the defense mechanism, which determines the pathogenesis of several diseases (2).
L-carnitine (L-3-hydroxy-4-N-N-trimethyl amino-butyrate) facilitates the entry of long chain fatty acids into the mitochondria, for oxidation and production of adenosine triphosphate (ATP) in different tissues (3). L-carnitine (LC) is an essential nutrient; 75% obtained from the diet and 25% synthesized endogenously (3,4). Several studies have shown the antioxidant effect of LC in different diseases, either as a scavenger or as a factor that increases the activity of antioxidant enzymes (3,5,6).
There are few studies on the effect of LC on oxidative stress in experimental models with high fructose diet. The aim of this research is to evaluate the effect of LC on oxidative stress associated with excessive fructose consumption in an experimental model with Holtzman strain rats.
|
KEY MESSAGES |
|
Motivation for the study: The L-carnitine (LC) produced in tissues has a role in the lipid metabolism. Its antioxidant role in a model of fructose-induced oxidative stress has not been fully evaluated. Fructose is a highly-consumed sugar that is mainly present in processed foods. Main findings: The administration of LC to Holtzman rats decreased liver lipoperoxidation and increased insulin production. LC administered during the oxidative stress model increased the activity of the mitochondrial superoxide dismutase (Mn-SOD) enzyme and significantly improved HOMA-IR. Implications: LC shows an antioxidant role under this model. Additionally, this study was conducted in a national laboratory and contributes with new evidence. |
MATERIALS AND METHODS
Population and sample
This experimental research was carried out on four groups, two of which received water on demand and food with and without LC, and the other two received fructose (40%) on demand and food with and without LC.
Animals and diet
We used 24 two-month-old male Holtzman rats with an approximate weight of 217 ± 40 g, purchased from Instituto Nacional de Salud (Lima, Peru). They were placed in polycarbonate cages with stainless metal lids throughout the study. They were kept for seven days under acclimatization and received tap water on demand as well as food based on a commercial concentrate obtained from Universidad Nacional Agraria La Molina. The experiment was carried out in the vivarium of the Faculty of Medicine of Universidad Nacional Mayor de San Marcos, at room temperature between 23 and 26 °C, and a relative humidity of 60-70% with 12 hours of light/darkness. The LC (500 mg/kg per 24 h) was orally administered by an orogastric cannula.
We formed 4 groups, each with 6 rats randomly assigned with the OpenEpi program. Acclimatization conditions were maintained.
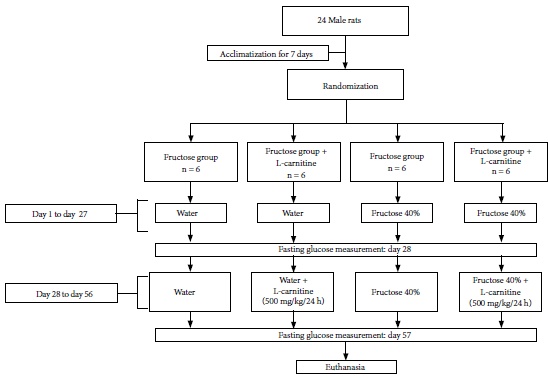
The control group (C) received feed and tap water on demand during the whole experiment; the control + L-carnitine group (C+LC) received feed and tap water on demand during the whole experiment plus L-carnitine at 500 mg/kg/24 h from day 28; the fructose (F) group received feed and fructose (40%) on demand during the whole experiment; and the fructose + L-carnitine group (F+LC) received feed and fructose (40%) on demand during the whole experiment and L-carnitine 500 mg/kg/24 h from day 28.
On the 27th and 56th days of the experiment, all the rats were fasted for the glycemia measurement. On day 57 the rats were euthanized by decapitation, after rapid and deep ether sedation. The flow chart was followed according to figure 1.
Figure 1. Treatment flow chart for rats from day 1 to day 57.
Fructose and L-carnitine preparation
The solutions were prepared daily: D-fructose >99% (Omnichem S.A.C, from Wuxi, China) and LC at 10% (Omnichem S.A.C, Ningbo, China). The tap water with fructose (40%) was based on the weight/volume formula.
Preparation of the homogenized products
The liver was washed by perfusion with 0.154 M KCl. The homogenates were prepared at 10% in saline phosphate buffer (SPB) using a Potter-Elvehjem type glass homogenizer. Three centrifugations were carried out at 4 °C (refrigerated centrifuge model MPW380R, MPW Med instruments); the first one was at 700 g for 5 minutes and the precipitate was discarded; the second one, with the supernatant, was at 9,500 g for 15 minutes. The supernatant corresponded to the post-mitochondrial fraction, and the precipitate corresponded to the mitochondrial fraction. The precipitate was washed twice with the SPB buffer at the same speed and for the same time as were needed to obtain the mitochondria. Then it was resuspended with 2 mL of the same buffer. Similarly, we prepared the pancreatic homogenate, which was the supernatant obtained after only one centrifugation at 700 g for 5 minutes.
Measurement of free carnitine, glucose, insulin, and the HOMA-IR
The blood samples were obtained from the tail vein. Glycemia was determined with a glucometer based on the conductometric method (Accu-chek Instant) on day 28 and day 57. Insulin measurement in plasma and pancreatic homogenate was performed with the ELISA kit on day 57 (Sigma-Aldrich, USA). Insulin resistance was evaluated with the insulin resistance homeostatic model assessment: HOMA-IR= [glucose (mg/dL) × insulin (mUI/mL)] /405. The measurement of free LC in the liver homogenate was performed with the ELISA kit (Sigma-Aldrich, USA).
Superoxide dismutase activity
We measured superoxide dismutase activity on the liver tissue, according to Marklund and Marklund (7). The inhibition of pyrogallol autooxidation in alkaline medium was the same for superoxide dismutase (SOD) activity in the mitochondrial fraction (Mn-SOD) and for the post-mitochondrial fraction (Cu/Zn-SOD). The kinetics was followed for three minutes at 420 nm in a spectrophotometer (Thermo Fisher Scientific, G10S UV-Vis). To report the enzymatic activity, the definition of the SOD unit was taken as 1U SOD=Δ of absorbance 0.02/2 × min (±10%).
Measurement of lipoperoxidation
After precipitation with 20% trichloroacetic acid, we measured the action between thiobarbituric acid and the decomposition products of lipoperoxidized species, such as malondialdehyde (MDA) in the hepatic homogenization, and obtained a colored complex that was read at 535 nm. The molar extinction coefficient (ε) was 1.56 × 10⁵ M-1 cm-1 (8).
Total protein measurement
Total proteins were quantified by the Biuret method (9); the reading was done after five minutes at 540 nm. We used a 2% albumin solution as a standard and measured total proteins in the mitochondrial and post-mitochondrial fractions obtained from the homogenized liver (8).
Statistical analysis
We used Shapiro Wilk’s test to evaluate normality and Bartlett’s test for variance homogeneity, and the parametric analysis of variance (ANOVA) and Scheffé’s test as post hoc tests for multiple comparisons. Statistical significance was assumed when the value was p < 0.05. We used the statistical program Stata 13.
Ethical aspects
We followed the ethical standards detailed in the Guideline for Handling and Care of Laboratory Animals of Ministerio de Salud - Instituto Nacional de Salud. The chosen type of euthanasia is contemplated in Law 30407, Law of Protection and Welfare of Animals.
RESULTS
Fasting glycemia results and the HOMA-IR scores did not show significant variations. However, the HOMA-IR score increased by 28.3% because of fructose consumption, when compared to the C group. In the F+LC group, it decreased by 25.8% compared to the F group (Table 1).
Table 1. Serum and liver parameters.
|
Parameter |
Control (C) |
Control + |
Fructose (F) |
Fructose + |
p value a |
|
Serum parameters |
|
|
|
|
|
|
Fasting glucose - day 28 (mg/dL) |
85.1 ± 8.6 |
82.5 ± 3.9 |
85.5 ± 6.3 |
81.8 ± 16.4 |
0.912 |
|
Fasting glucose - day 57 (mg/dL) |
76.5 ± 12.9 |
85.3 ± 5.2 |
78.8 ± 10.6 |
77.6 ± 4.33 |
0.689 |
|
HOMA-IR |
2.4 ± 0.4 |
2.8 ± 0.6 |
3.1 ± 0.1 |
2.3 ± 0.30 |
0.131 |
|
Liver parameters |
|
|
|
|
|
|
Level of free L-carnitine (nmol/g of tissue) |
553.9 ± 96.8 |
659.3 ± 42.3 |
602.8 ± 48.1 |
673.9 ± 64.6 b |
0.037 |
|
Mitochondrial total proteins (mg/dL) |
50.5 ± 11.1 |
76.3 ± 14.7 b |
62.0 ± 12.6 |
65.7 ± 10.2 |
0.018 |
|
Post-mitochondrial total proteins (mg/dL) |
27.8 ± 6.7 |
41.1 ± 5.8 b |
32.2 ± 1.4 |
36.5 ± 6.9 |
0.008 |
Values expressed as a mean ± standard deviation
a ANOVA test, b statistically significant compared to
the control group
Free LC, mitochondrial and post-mitochondrial total proteins showed significant group difference in liver tissue. However, the only significant difference in peer evaluation was found in the free LC, which showed an increase of 21.5% in the F+LC group compared to the C group (Table 1).
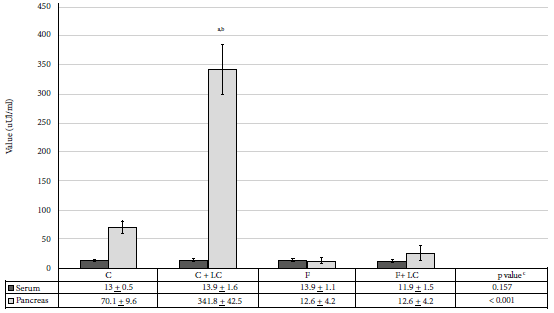
The administration of LC stimulated production of insulin in the pancreatic tissue. The increase of insulin levels in the C+LC group was highly significant (p < 0.001) compared to the C group; the increase was of 387% (341.8 ± 42.5 vs. 70.1 ± 9.6 µIU/mL). Fructose consumption produced a significant decrease (p < 0.01) in pancreatic insulin (12.6 ± 4.2 µIU/mL). LC administration plus 40% fructose consumption produced a 100% recovery rate (25.8 ± 12.7 vs. 12.6 ± 4.2 µIU/mL), but this value was not like the one obtained from group C (Figure 2).
C: control group, C+LC:
control + L-carnitine group, F: fructose group, F+LC: fructose group +
L-carnitine Values expressed as mean ± standard deviation
a statistically significant compared to the control group, b
statistically significant compared to the fructose group, c ANOVA
test
Figure 2. Serum and pancreas insulin values of the studied groups.
During the macroscopic evaluation, we observed that fructose increased abdominal fat in the F group and the F+LC group. The increased fat mass included the mesentery and retroperitoneum compared to the C group and the C+LC group.
During the histological evaluation of the pancreatic tissue, we observed that the presence of LC (C+LC group) increased the number and size of the islets of Langerhans, even more than the pancreatic acini, compared to the other groups. In the F group and the F+LC group, the size of the islets of Langerhans increased in some regions near the blood vessels when compared to the C group (Figure 3).
C: control group, C+LC:
control + L-carnitine group, F: fructose group, F+LC: fructose + L-carnitine
group
In the image for the C group, 2 to 3 islets of Langerhans can be observed in
the field, without any other important aspect to describe. In the C+LC group
image there is an increase in the number and size of the islets of
Langerhans. In the F and F+LC groups there is an increase in size of the
Langerhans islands, it is more noticeable in the last group.
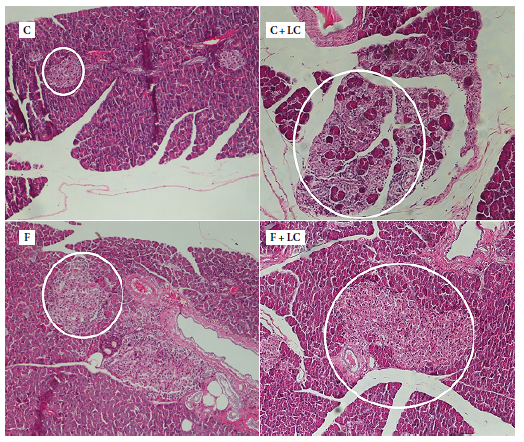
Figure 3. Photomicrographs of rat pancreas cuts. Hematoxylin/eosin10×.
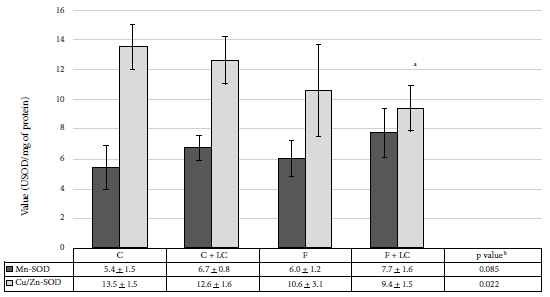
When evaluating the antioxidant effect, we observed a significant decrease of 30.5% of Cu/Zn‑SOD activity in the F+LC group when compared to the C group (9.4 ± 1.5 vs. 13.5 ± 1.5 USOD/mg protein, p < 0.05) (Figure 4). However, the compensatory change in both fractions was notorious, while the activity decreased at the post-mitochondrial level, we observed an increase in the mitochondrial activity.
C: control group, C+LC:
control + L-carnitine group, F: fructose group, F+LC: fructose + L-carnitine
group. Values expressed in mean ± standard deviation. Figure 4. Superoxide dismutase (SOD) activity in
liver tissue of the studied groups. The administration of LC
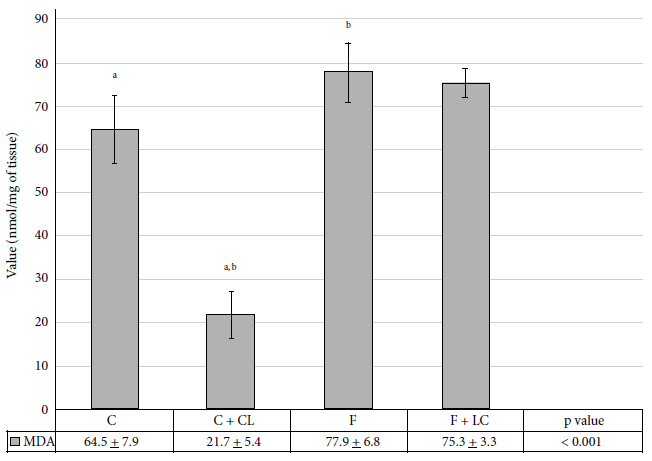
produced a significant decrease in MDA levels (p < 0.01) compared to the C
group. Consumption of fructose (40%) (F group) caused a significant increase
of 21% (p = 0.03) compared to the C group. LC administration plus fructose
consumption did not show a significant decrease of the MDA levels (Figure 5).
Control group, C+LC: control
+ L-carnitine group, F: fructose group, F+LC: fructose + L-carnitine group.
Values expressed in mean ± standard deviation.
Figure 5. The level of malondialdehyde (MDA) in the
liver tissue of the groups studied. DISCUSSION We have observed that the
administration of LC plays an antioxidant role, related to the excessive
consumption of fructose in rats of the Holtzman strain. Fructose is a sugar added
to processed foods and its consumption has increased in various societies.
Excessive fructose intake is associated with insulin resistance, obesity,
dyslipidemia, and metabolic syndrome (1,2,10,11). L-carnitine is
an endogenous aminoacid associated with lipid metabolism; it has also been
reported to have antioxidant activity. The model of
fructose-induced oxidative stress was used because of the metabolic changes
it produces in serum and tissue. Fructose can generate ROS in vivo
and in vitro, as does glucose (1,2,10,). In this study,
fructose (40%) on demand did not modify the fasting plasma glucose levels
during eight weeks. Similar results were reported by Andrade et al.
(11) who used fructose (10%) as treatment on demand for 18 weeks.
However, Mamikutty et al. (1) demonstrated increased
glycemia using fructose at 20% and 25% in Wistar rats for eight weeks. Also,
Bulboacă et al. (2) reported increased glycemia using
fructose (10%) in Wistar rats for 12 weeks. It is important to mention that
there are genetic differences that express metabolic variations according to
each rat strain (12). There is a significant
difference between the absorption process of fructose and glucose. Fructose
is absorbed by the GLUT 5 transporter, regardless of the absorption of
glucose. After various processes, fructose can enter glycolysis, avoiding
the hexokinase and phosphofructokinase-1 regulation points (10).
Entering glycolysis provides metabolites for lipogenesis and inhibits the
beta-oxidation process. This process could explain the increase of visceral
fat in the F group and F+LC group that we, macroscopically, observed. On the
other hand, fructose is not an accurate way to measure glycemia at the
pancreatic level, because beta-pancreatic cells do not have GLUT 5
transporters (1,10), so fructose metabolism is independent of
insulin and would not increase glycemia (10), which would explain
the results. Moreover, fructose is related to the conservation of plasma
insulin, expressed as HOMA-IR, where we did not observe no significant
differences in the groups. HOMA-IR, as a parameter of insulin resistance,
showed an increase of 28.3% in the F group compared to the C group; this
moderate increase would suggest that the use of fructose for a longer time
could generate insulin resistance, as described in other studies (1,2,10,13).
Furthermore, a decrease of 25.8% was observed in the F+LC group compared to
the F group. For example, Ringseir et al. (14) reviewed
six studies on rats in which LC decreased glycemia and the HOMA-IR. Fructose consumption
produced a significant decrease in the level of insulin in the pancreas.
This result, observed in the F group, can be related to the increase of the
number and size of adipocytes, which causes the release of MCP-1, which
leads to the recruitment of macrophages-M1 and the release of cytokines such
as TNF-α, IL1 and IL6, which cause a state of chronic inflammation (15).
Likewise, TNF-α binds to its death receptor, activating the extrinsic
pathway and then the intrinsic pathway of apoptosis to finally produce the
death of the beta-pancreatic cells (16). Maiztegui et al.
(17) used 10% fructose on free demand for three weeks and showed the
reduction of the number of beta-pancreatic cells due to increased apoptosis.
In contrast, during the histological evaluation we observed an increase of
the size of the islets of Langerhans in the F group, probably due to
compensatory effect of the stimulation of islets’ alpha, delta, F and G
cells. By using this model of
stress induced by fructose at 40% consumed on free demand, we observed that
the administration of LC (F+LC group) induced a recovery of 100% of tissue
insulin when compared to the consumption of only fructose (group F), this
result, although not significant for this study, is important because it is
evidence of the role of LC in the pancreatic tissue. On the other hand, the
C+LC group had a different behavior, we observed a 387% increase in the
level of insulin, and a greater number and size of the islets of Langerhans
(there were even more islets by regions) than pancreatic acini compared to C
group. Several studies show that
the administration of LC inhibits apoptosis. Bonomini et al.
(18) reviewed different studies and suggested that LC could possibly
inhibit caspase 3. Agarwal et al. (6) reported a similar
result after analyzing several studies, they found that LC inhibits caspases
3, 7 and 8 and regulates tumor suppressor proteins, which favors oocyte
survival. Likewise, Cao et al. (3) conducted an in
vitro study and found that the use of LC favors the decrease of the
Bax/Bcl-2 ratio and the production of ROS. In metabolic terms, according to
the study by Jiang et al. (19), the presence of LC favors
the expression of CPT1 mediated by PPARγ, which increases the process of
beta-oxidation. The results of our study lead us to believe that LC could
inhibit apoptosis of beta-pancreatic cells, which significantly increased
the level of pancreatic insulin in the C+LC group, while in the F + LC group
it did not increase as much due to previous damage by fructose. Therefore,
the administration of LC (C+LC group) demonstrated the ability to
significantly (p < 0.01) stimulate insulin production at the tissue level
(Figure 2) without affecting the plasma levels of the hormone. In the liver, free LC
levels increased significantly by 21.5% when it was given as a treatment to
F group compared to group C. In addition, we observed that the
administration of LC did not produce a significant increase with their
peers, probably because LC can act as a scavenger. According to Gülçin
(20) the in vitro LC acts as a scavenger of superoxide anion
and hydrogen peroxide and favors the chelation of the ferrous ion, due to
its carbonyl group, which can stabilize free radicals in alpha carbon by
conjugation. It can also be stated that the levels of free LC are stable in
physiological situations. However, this changes under physiopathological
conditions, such as the consumption of fructose through various mechanisms
as reported by Chang et al. (4), who stated that the
increase of ROS could reduce the expression and function of OCTN-2
(carnitine transporter in the plasma membrane of tissues). In different studies,
long-term fructose consumption increased the production of ROS (2,21).
NADH and FADH2 are produced when fructose enters glycolysis and
the Krebs cycle. These two molecules then go to the electron transport chain
in the mitochondria, where there is a large production of superoxide anion.
If fatty acids are formed, they can be metabolized by beta-oxidation, which
produces ROS and acetyl-CoA, which can generate more NADH and FADH2
(22). In this sense, Furukawa et al. (16) reported
greater activity of the NAPDH-oxidase in the adipocytes of obese people and
a decrease in the expression of antioxidant enzymes, which can easily
generate oxidative stress. The higher production of
ROS compromises the antioxidant defense mechanisms; at the enzymatic level,
SOD is the first one that acts against the univalent reduction of oxygen. As
mentioned, LC exerts its main role in the mitochondria, this can explain the
25% increase in mitochondrial enzyme activity on the C group. The LC role in
the mitochondria can also explain the slight increase of LC levels (C + LC
group). Also, we observed a coupled behavior between cytosolic and
mitochondrial isoenzymes. When compared to the C group, the F+LC group
showed a 30.5% decrease of the Cu/Zn-SOD activity, while the Mn-SOD activity
increased 42%. According to Suzuki et al. (23), excess ROS
may lead to inhibition of the Cu/Zn-SOD enzyme and an increase of Mn-SOD,
which is probably an adaptive response to ROS production. It should be noted
that Mn-SOD is probably the most important enzyme for survival in an
oxidative environment (24). In this oxidative
environment, derived from mitochondrial activity, LC administration favors
the production of large amounts of acetyl-CoA, which generates acetyl groups
for protein or histone acetylation processes, and produces
post-translational or epigenetic changes (25). In their research,
Kerner et al. (26) observed that acetyl-CoA treatment
increased Mn-SOD acetylation. It can be assumed that acetylation could favor
increased the activity of this enzyme. On the other hand, we observed in the
C+LC group a significant increase of mitochondrial and post-mitochondrial
total protein levels, a similar effect was observed in the F group, although
it was not significant. These results allow us to presume that the LC would
not only act as an activity regulator, but could also be related to protein
synthesis, which includes antioxidant enzymes. The assessment of
lipoperoxidation shows the damage made to the membrane by peroxidative
reactions of polyunsaturated fatty acids (PUFA); the level of MDA is
considered a marker of oxidative stress. The antioxidant properties of LC
displayed in liver tissue were also observed in the MDA levels, which
significantly decreased (p < 0.01) in the absence of oxidative stress
factors such as fructose, which corroborates the scavenger role discussed
above (3,4,6,20). Consumption of fructose at 40% on free demand
produced an increase in lipoperoxidation by 21%, and the administration of
LC could not reverse this change. The consumption of fructose generated a
large amount of ROS, so probably a longer treatment time could reduce
oxidative stress, expressed as MDA, as has been shown in other studies (5,27,28).
Lipoperoxidation could be diminished by mechanisms that increase the
expression of Mn-SOD and Cu/Zn-SOD, which is mediated by the increase of the
mRNA expression of PPARα, as reported by Liu et al. (29). Several studies show that
the presence of PPAR activates the expression of Mn-SOD and Cu/Zn-SOD genes
through the transcriptional pathway (5,29,30). Then, based on the
results of this study, we could propose that a longer treatment with LC
would reduce the levels of ROS, which would avoid the lipoperoxidation and
its harmful effects at the cellular level. The availability of
resources was one of the limitations of our study, therefore we could not
assess the basal concentrations of MDA and SOD and why a longer treatment
was not used. In conclusion, we observed
that fructose does not affect glycemia, but it favors lipogenesis and an
oxidative environment; in this scenario, administration of LC favors
metabolic changes that corroborate its antioxidant function. Acknowledgements:
he authors wish to thank the following contributors: Dr. Conrad Ortiz, for
his help in reviewing the article; Dr. Eddy R. Segura, for his help in
statistical consulting; and Lic. Marta Miyashiro, for her help in
proofreading. Authors’ contributions:
MMA and SSC participated in the conception and design of the article, in the
analysis and interpretation of data, and in the writing of the article. In
addition, MMA came up with the research idea and SSC obtained funding. LSV
and SSC participated in the analysis and interpretation of the data. All
authors participated in data collection, critical review of the article and
approval of the final version. Conflicts of interest:
The authors declare no conflict of interest. Funding:
Partial funding from the Vice-rectorate for Research and Graduate Studies of
Universidad Nacional Mayor de San Marcos, project A17012211. REFERENCES 1. Mamikutty N, Thent ZC,
Sapri SR, Sahruddin NN, Mohd Yusof MR, Haji Suhaimi F. The Establishment of
Metabolic Syndrome Model by Induction of Fructose Drinking Water in Male
Wistar Rats. Biomed Res Int. 2014;2014:263897. doi: 10.1155/2014/263897. 2. Bulboacă A, D Bolboacă
S, Suci S. Protective effect of curcumin in fructose-induced metabolic
syndrome and in streptozotocin-induced diabetes in rats. Iran J Basic Med
Sci. 2016;19(6):585–93. 3. Cao Y, Li X, Shi P, Wang
L, Sui Z. Effects of L-Carnitine on High Glucose-Induced Oxidative Stress in
Retinal Ganglion Cells. Pharmacology. 2014;94(3–4):123–30. doi:
10.1159/000363062. 4. Chang B, Nishikawa M,
Nishiguchi S, Inoue M. L-carnitine inhibits hepatocarcinogenesis via
protection of mitochondria. Int J Cancer. 2005;113(5):719–29. doi:
10.1002/ijc.20636. 5. Li J-L, Wang Q-Y, Luan
H-Y, Kang Z-C, Wang C-B. Effects of L-carnitine against oxidative stress in
human hepatocytes: involvement of peroxisome proliferator-activated receptor
alpha. J Biomed Sci. 2012;19:32. doi: 10.1186/1423-0127-19-32. 6. Agarwal A, Sengupta P,
Durairajanayagam D. Role of L-carnitine in female infertility. Reprod Biol
Endocrinol. 2018;16(1):5. doi: 10.1186/s12958-018-0323-4. 7. Marklund S, Marklund G.
Involvement of the superoxide anion radical in the autoxidation of
pyrogallol and a convenient assay for superoxide dismutase. Eur J Biochem.
1974;47(3):469–74. doi: 10.1111/j.1432-1033.1974.tb03714.x. 8. Buege JA, Aust SD.
Microsomal lipid peroxidation. Methods Enzymol. 1978;52:302–10. doi:
10.1016/s0076-6879(78)52032-6. 9. Gornall AG, Bardawill
CJ, David MM. Determination of serum proteins by means of the biuret
reaction. J Biol Chem. 1949;177(2):751–66. 10. Tappy L, Lê K-A.
Metabolic effects of fructose and the worldwide increase in obesity. Physiol
Rev. 2010;90(1):23–46. doi: 10.1152/physrev.00019.2009. 11. Andrade N, Andrade S,
Silva C, Rodrigues I, Guardão L, Guimarães JT, et al. Chronic
consumption of the dietary polyphenol chrysin attenuates metabolic disease
in fructose-fed rats. Eur J Nutr. 2020;59(1):151-165. doi:
10.1007/s00394-019-01895-9. 12. Conn PM. Animal Models
for the Study of Human Disease [Internet]. Elsevier; 2013 [citado el 22 de
julio de 2019]. Disponible en:
https://linkinghub.elsevier.com/retrieve/pii/C20110052250. 13. Suwannaphet W, Meeprom
A, Yibchok-Anun S, Adisakwattana S. Preventive effect of grape seed extract
against high-fructose diet-induced insulin resistance and oxidative stress
in rats. Food Chem Toxico. 2010;48(7):1853–7. doi:
10.1016/j.fct.2010.04.021. 14. Ringseis R, Keller J,
Eder K. Role of carnitine in the regulation of glucose homeostasis and
insulin sensitivity: evidence from in vivo and in vitro studies with
carnitine supplementation and carnitine deficiency. Eur J Nutr.
2012;51(1):1–18. doi: 10.1007/s00394-011-0284-2. 15. Guilherme A, Virbasius
JV, Puri V, Czech MP. Adipocyte dysfunctions linking obesity to insulin
resistance and type 2 diabetes. Nat Rev Mol Cell Biol. 2008;9(5):367–77.
doi: 10.1038/nrm2391. 16. Furukawa S, Fujita T,
Shimabukuro M, Iwaki M, Yamada Y, Nakajima Y, et al. Increased
oxidative stress in obesity and its impact on metabolic syndrome. J Clin
Invest. 2004;114(12):1752–61. doi: 10.1172/JCI200421625. 17. Maiztegui B, Borelli
MI, Madrid VG, Del Zotto H, Raschia MA, Francini F, et al.
Sitagliptin prevents the development of metabolic and hormonal disturbances,
increased β-cell apoptosis and liver steatosis induced by a fructose-rich
diet in normal rats. Clin Sci. 2011;120(2):73–80. doi: 10.1042/CS20100372. 18. Bonomini M, Zammit V,
Pusey CD, De Vecchi A, Arduini A. Pharmacological use of L-carnitine in
uremic anemia: has its full potential been exploited? Pharmacol Res.
2011;63(3):157–64. doi: 10.1016/j.phrs.2010.11.006. 19. Jiang F, Zhang Z, Zhang
Y, Wu J, Yu L, Liu S. L-carnitine ameliorates the liver inflammatory
response by regulating carnitine palmitoyltransferase I-dependent PPARγ
signaling. Mol Med Rep. 2016;13(2):1320–8. doi: 10.3892/mmr.2015.4639. 20. Gülçin I. Antioxidant
and antiradical activities of L-carnitine. Life Sci. 2006;78(8):803–11.doi:
10.1016/j.lfs.2005.05.103. 21. Germoush MO, Elgebaly
HA, Hassan S, Mahmoud AM. Anti - Diabetic Effects of Padina Pavonia in
Fructose - Induced Diabetic Rats. Aljouf Sci Eng J. 2015;286(3104):1–7. doi:
10.12816/0023935. 22. Tangvarasittichai S.
Oxidative stress, insulin resistance, dyslipidemia and type 2 diabetes
mellitus. World J Diabetes. 2015;6(3):456–80. doi: 10.4239/wjd.v6.i3.456. 23. Suzuki K, Miyazawa N,
Nakata T, Seo HG, Sugiyama T, Taniguchi N. High copper and iron levels and
expression of Mn-superoxide dismutase in mutant rats displaying hereditary
hepatitis and hepatoma (LEC rats). Carcinogenesis. 1993;14(9):1881–1884.
doi: 10.1093/carcin/14.9.1881. 24. Case AJ. On the Origin
of Superoxide Dismutase: An Evolutionary Perspective of Superoxide-Mediated
Redox Signaling. Antioxidants (Basel) Switz. 2017;6(4):82. doi:
10.3390/antiox6040082. 25. Madiraju P, Pande SV,
Prentki M, Madiraju SRM. Mitochondrial acetylcarnitine provides acetyl
groups for nuclear histone acetylation. Epigenetics. 2009;4(6):399–403. doi:
10.4161/epi.4.6.9767. 26. Kerner J, Yohannes E,
Lee K, Virmani A, Koverech A, Cavazza C, et al. Acetyl-L-carnitine
increases mitochondrial protein acetylation in the aged rat heart. Mech
Ageing Dev. 2015;145:39–50. doi: 10.1016/j.mad.2015.01.003. 27. Zambrano S, Blanca AJ,
Ruiz-Armenta MV, Miguel-Carrasco JL, Revilla E, Santa-María C, et al.
The renoprotective effect of L-carnitine in hypertensive rats is mediated by
modulation of oxidative stress-related gene expression. Eur J Nutr.
2013;52(6):1649–59. doi: 10.1007/s00394-012-0470-x. 28. Lee B-J, Lin J-S, Lin
Y-C, Lin P-T. Effects of L-carnitine supplementation on oxidative stress and
antioxidant enzymes activities in patients with coronary artery disease: a
randomized, placebo-controlled trial. Nutr J. 2014;13:79. doi:
10.1186/1475-2891-13-79. 29. Liu X, Jang SS, An Z,
Song H, Kim W-D, Yu J-R, et al. Fenofibrate decreases radiation
sensitivity via peroxisome proliferator-activated receptor α-mediated
superoxide dismutase induction in HeLa cells. Radiat Oncol J.
2012;30(2):88–95. doi: 10.3857/roj.2012.30.2.88. 30. Kim T, Yang Q.
Peroxisome-proliferator-activated receptors regulate redox signaling in the
cardiovascular system. World J Cardiol. 2013;5(6):164. doi:
10.4330/wjc.v5.i6.164. Correspondence:
Marilin Maguiña Alfaro; Jr. Francisco de Zela 217, San Juan de Lurigancho,
Lima, Perú; marilinpaola@gmail.com Cite as:
Maguiña-Alfaro M, Suárez-Cunza S, Salcedo-Valdez L, Soberón-Lozano M,
Carbonel-Villanueva K, Carrera-Palao R. Antioxidant role of L-carnitine in
an experimental model of oxidative stress induced by increased fructose
consumption. Rev Peru Med Exp Salud Publica. 2020;37(4). doi:
https://doi.org/10.17843/rpmesp.2020.374.4733.
Mn-SOD: superoxide dismutase in the mitochondrial fraction
Cu/Zn-SOD: superoxide dismutase in the post-mitochondrial fraction
a Statistically significant compared to the control group, b
ANOVA test
a Statistically significant compared to group F, b
statistically significant compared to group C
C group compared to the C+LC group (p value < 0.001), C group compared to
the F group (p value = 0.030), F group compared to the C+CL group (p value <
0.001), C group + LC compared to the F+LC group (p value < 0.001)